TT Solutions
Overview
Project summary
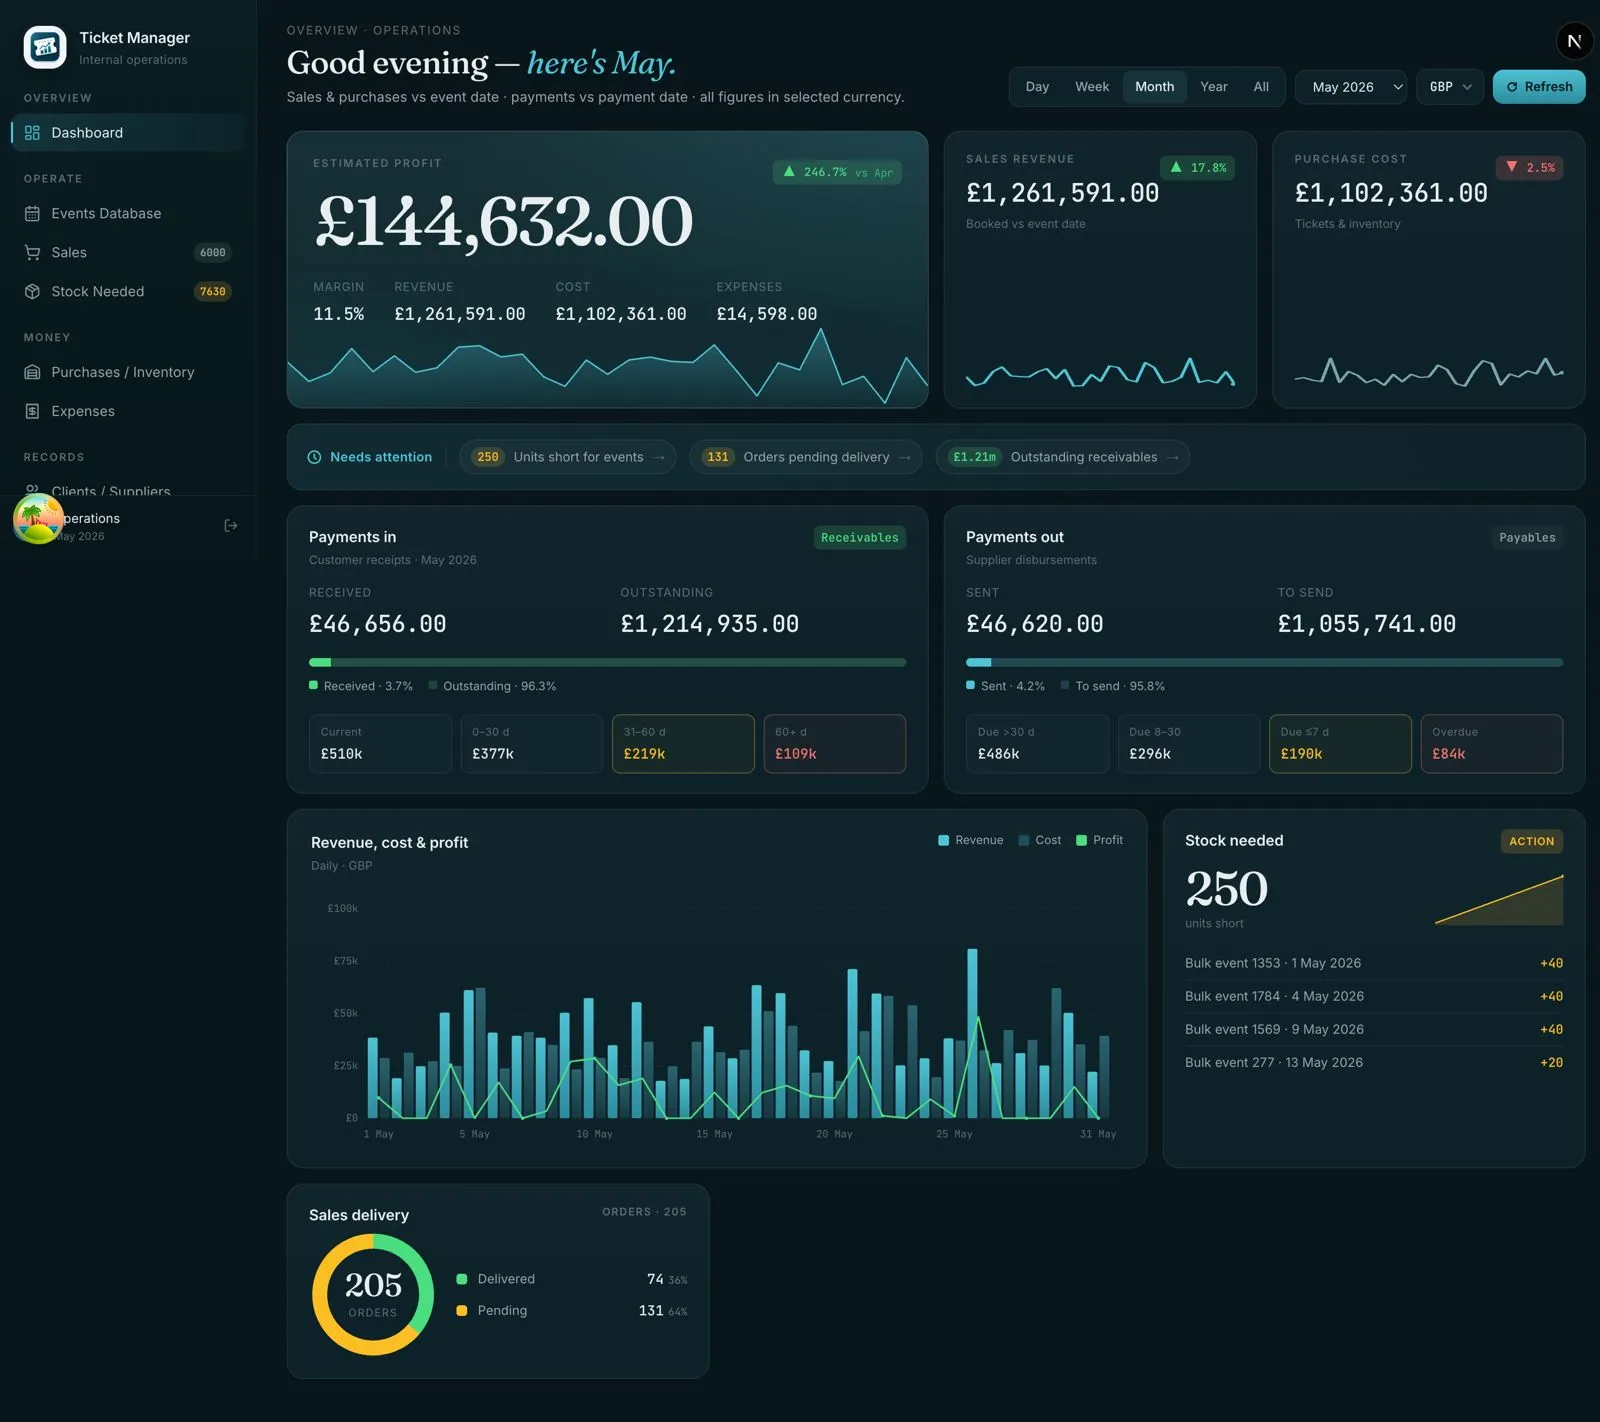
A business analytics dashboard giving TT Solutions' clients real-time visibility into their operational metrics from a single, clean interface.
Case study details
- The problem
- Data was siloed across multiple systems, making it impossible for managers to get a live picture of performance without stitching together spreadsheets manually.
- Our approach
- Built a React + TypeScript dashboard with a modular chart system, role-based access, and a data pipeline that pulls from the client's existing sources without requiring a full backend rewrite.
- The outcome
- Delivered a live analytics product that the client's customers actively use daily — replacing a manual reporting process that previously took hours each week.
Technology
Tech stack
- React
- TypeScript
- Analytics
Project links
Work with us
Want results like these?
Tell us about your project. We scope precisely, quote honestly, and ship production software — not demos.
Get in touch